With Miro AI, you can now quickly create mind maps, flowcharts, idea cards and much more. We have tried out the new AI features and show you how well it works.
What can Miro AI do?
Miro AI can support some typical Miro processes with generative AI features. This allows you to achieve results much faster than if you think up everything yourself and start from scratch. Depending on the use case, 30% more efficiency is possible, as this can significantly speed up the start of a new project.
Miro AI has these AI features:
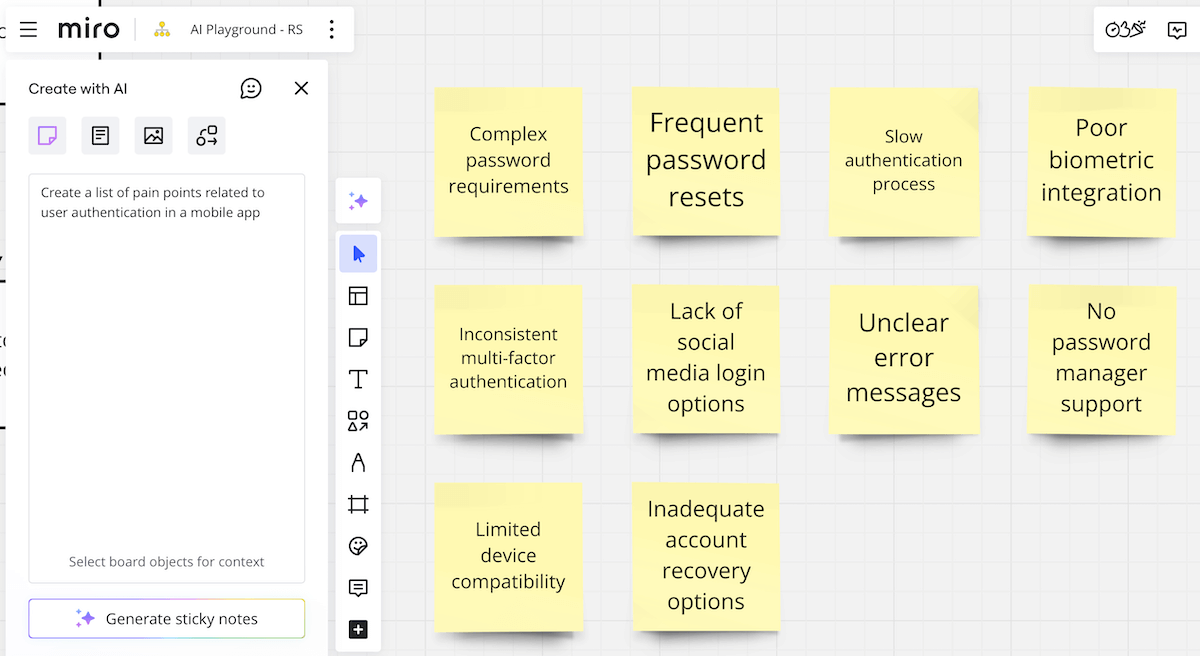
- Sticky notes – Idea cards are created with a click, e.g. for a new project
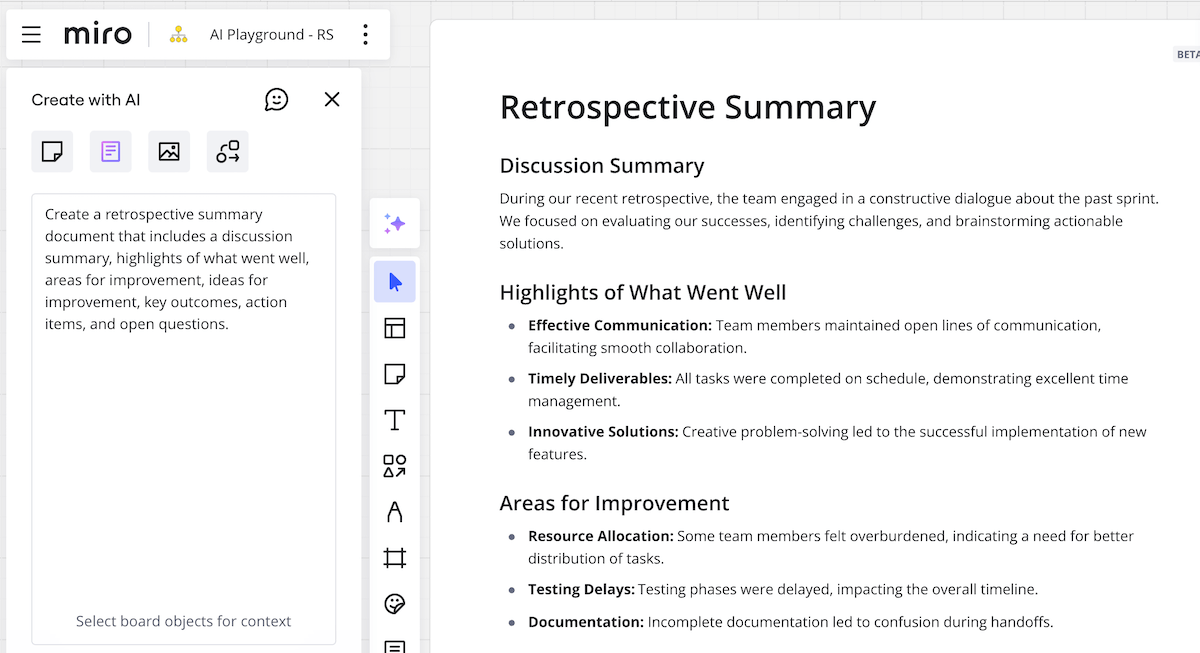
- Documents – Miro directly creates a formatted template for customization, e.g. for retro summary, project proposal, reports and any other documents
- Images – in various styles, e.g. flat, comic, 3D and more
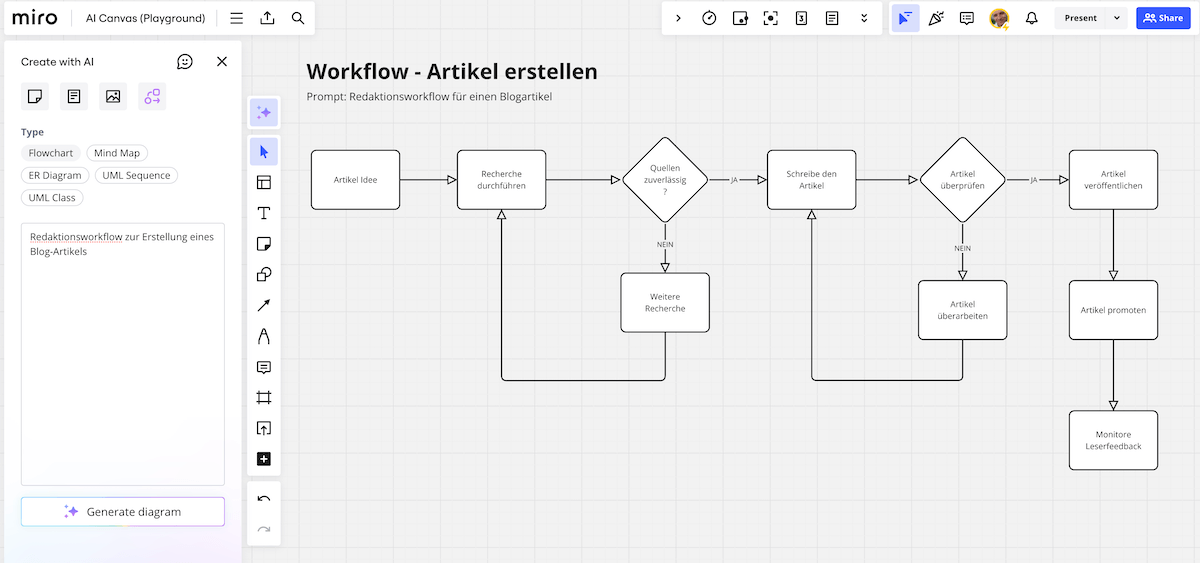
- Charts – The AI killer feature can now quickly create flowcharts and more that you can easily customize.
Create sticky notes with Miro AI
Create documents with Miro AI
The charts that can now be generated using AI include
- Flowcharts
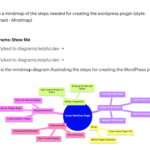
- Mind maps
- Entity relationship diagrams
- UML sequence diagrams and class diagrams
Create clear flowcharts with Miro AI
Visual representations such as flowcharts make it immediately clear what happens in which order. Flowcharts can be used to make particularly complex processes easy to understand.
Miro AI supports flowchart creation with simple prompt input. You can start at any time with a generic prompt, e.g. “Create a flowchart to create a blog article”. The LLM model used by Miro AI is well versed in various areas, so you can quickly create a simple visualization without putting a lot of energy into prompt design.
Result: Create simple flowcharts without effort
The flowcharts generated by Miro AI are a good representation of simple processes. You can freely change the charts, adapt texts, insert nodes and much more. Once generated, charts can only be adjusted manually, not by AI. You should therefore consider how exactly you create the prompt.
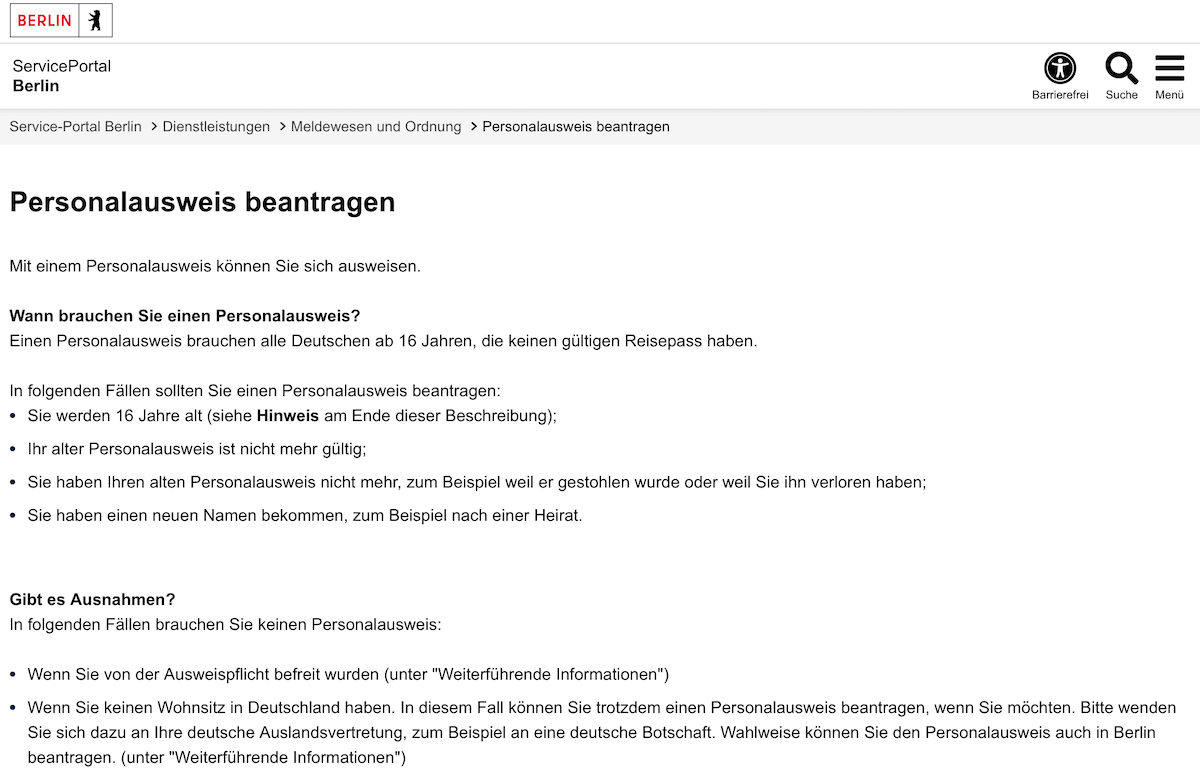
Prompt tip for chart creation: Copy the process description into the prompt
To better adapt the result to the desired facts, you can also copy an existing text into the prompt. This makes the diagram more closely related to the facts.
Tip: The clearer the description, the better the result. Good prompt design often simply means formulating the description precisely and concisely.
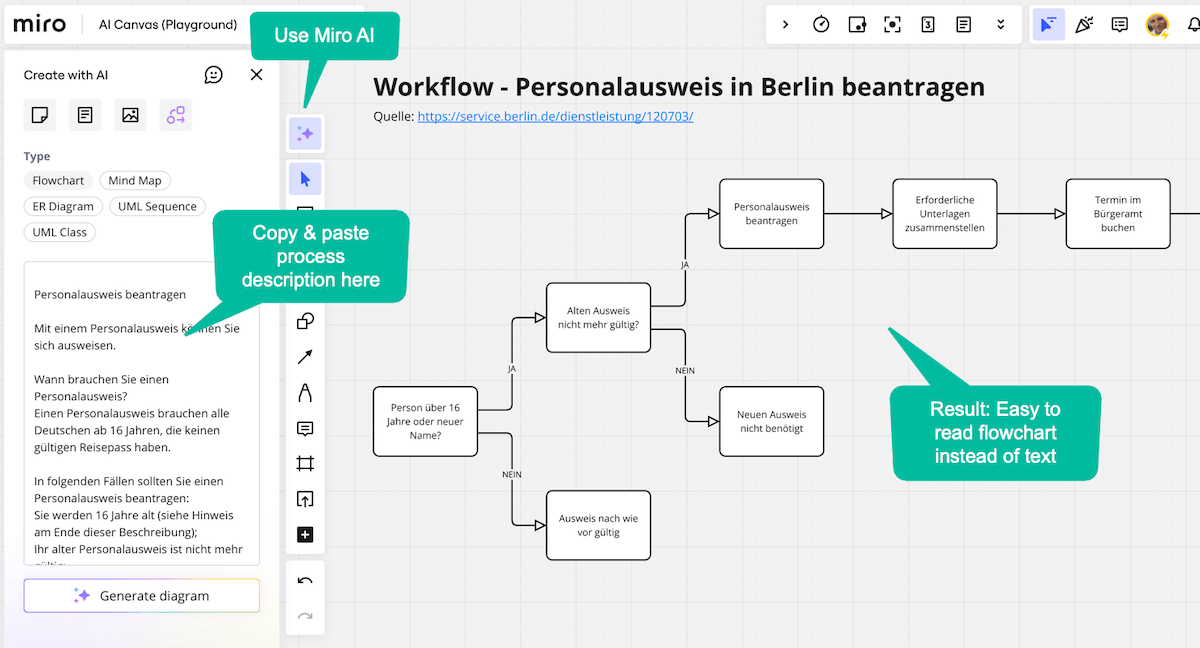
Example: Applying for an ID card in Berlin
Result: Accurate charts through more precise prompt design
Miro AI often produces good results if the prompt is designed accurately. However, as with any generative AI, you should not expect miracles, but rather specify exactly what you need.
Tips for prompt design for charts:
- Combine prompt description: “Create a flowchart with about 15 steps” Description of facts.
- Do not copy in texts that are too long
- Do not copy in “garbage”. The less clear the prompt, the more erroneous the result
Who owns the result generated by Miro AI?
Miro states the following in the legal disclaimer(link): “As between you and Miro, and to the extent permitted by applicable law, you retain your ownership rights in Input and you own the Output. We hereby assign to you all our right, title, and interest, if any, in and to Output.”. This allows you to use the Output in your own works.
Application examples: How you can use AI-generated visualizations
Visualizations make it immediately clear what the document is about and help text-heavy documents in particular to become clearer. Charts improve comprehensibility, user experience and increase the factual content of a document. This is why the Miro AI features are particularly helpful in enhancing any existing document. They can also be used to advance projects quickly, e.g. to develop a new solution in a joint workshop with different teams, plan advertising and information campaigns, improve processes and much more.
Examples of the benefits of AI-generated visualizations in all industries:
Here are some application examples of how AI-generated visualizations can be used to optimize projects in different industries:
- Software documentation: AI-generated diagrams and flowcharts visualize complex software architectures and processes to make them easier to understand. ER and UML diagrams and flowcharts are ideal here.
- Service portals (e-government): Interactive, AI-generated step-by-step instructions for applying for ID cards or re-registering in online portals.
- Websites and blogs (UX & SEO): Visualizations to explain processes, e.g. to optimize workflows or automate tasks. Pro tip: This simultaneously improves the UX and SEO of articles.
- Project management: AI-generated diagrams for task and time planning, especially for complex processes
- Marketing and advertising campaigns: Visualizations of the campaign strategy, product and target group strategies for new products.
- Sales and sales strategies: Visualizations that graphically represent the sales funnel, especially for new products and markets, and thus show optimization potential.
- Financial planning and reporting: Automatically generated financial charts and models that show trends, forecasts and cash flow developments.
- Product development: AI-based process and idea sketches that help to develop prototypes at an early stage and show how they can be used in which context.
- Supply chain management Visualizations of the supply chain that reveal bottlenecks or efficiency potentials
- Logistics and transport: visualization of transport routes and optimization of routes based on real-time data analysis using AI
- Training and e-learning platforms: Complex concepts, e.g. in mathematics or science, can be made more understandable through diagrams and interactive visualizations.
- Customer service: AI-generated diagrams that visualize ticket analyses, problem categories and suggested solutions to optimize support.
- Event planning and event management: Creation of flowcharts and visualization to optimize event management.
- Scientific visualizations: Complex data sets, e.g. from climate research or physics, can be made more understandable through AI-generated graphics and models.
These application examples show how broadly and diversely AI-generated visualizations can be used to increase clarity and efficiency in all industries.
