The new “Claude Artifacts” feature makes it easy for anyone to create interactive tools. These use cases show how it works. With all the prompts to follow.
What is Claude Artifacts?
Artifacts is a new feature that has been integrated into Anthropic’s chatbot solution Claude since June 2024 (see Claude 3.5 Sonnet Update). It greatly simplifies the creation of content such as code and applications. You enter the prompt on the left-hand side. You can then see and use the created application directly on the right-hand side.
What can you create with Artifacts?
Using generative AI, Claude.ai can now be used to create not only texts but also applications and small tools. In contrast to ChatGPT, you can try out the application in Claude.ai directly, as the AI creates executable HTML/Javascript code in the browser using the React framework. This is particularly advantageous when creating interactive content such as calculators, tools and analyses.
Examples of interactive content:
- Calculators: From simple mathematical to complex financial or scientific calculators.
- Quizzes: Applications that react immediately to user input and display results in real time.
- Forms and surveys: Interactive forms with immediate evaluation.
- Data visualizations: Dynamic charts and graphs that respond to user input.
- Games: Simple, browser-based games.
- Simulations: Physical or economic models that users can customize.
- Learning modules: Interactive tutorials and exercises.
- Interactive stories: Narratives in which users can influence the course of events.
Interactive content is the future of the web as it stands out from the monotonous text/image combinations. Here we show some impressive use cases for this content, which is now much easier to create thanks to AI.
Example 1: Simple infographics
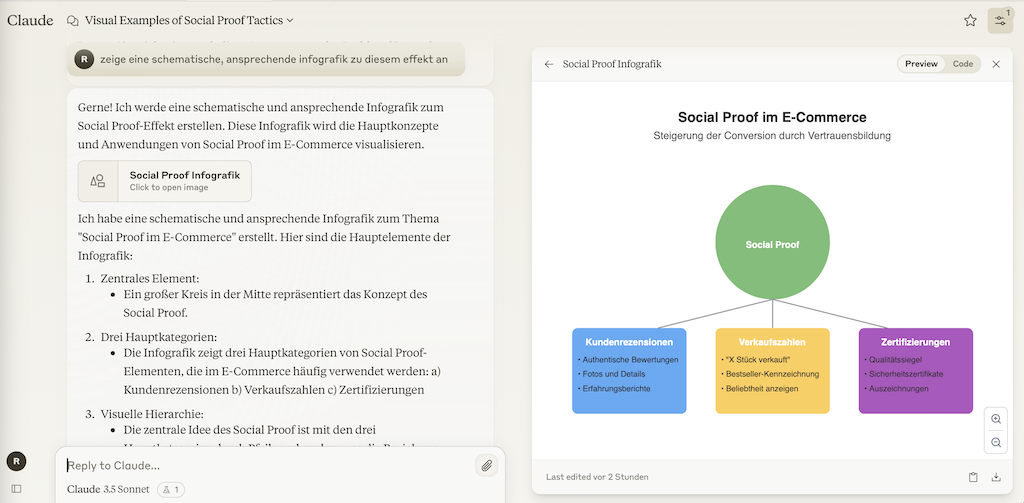
Infographics make connections in texts clearer and visually loosen up texts. With Claude, you can create and refine these directly until they match the desired style.

Prompt for infographics:
The prompt can be formulated very simply. However, you can’t expect any design miracles yet, as the graphics are generated using SVG.
Prompt:
Display a schematic, appealing infographic for this content:
[text to be visualized]
Ideas for prompt extensions:
- Use color palette: shades of blue
- Use icons
- Use diagram type “Mindmap” (or: Flowchart, Venn diagram, Word cloud etc.)
Example 2: ETF investment calculator
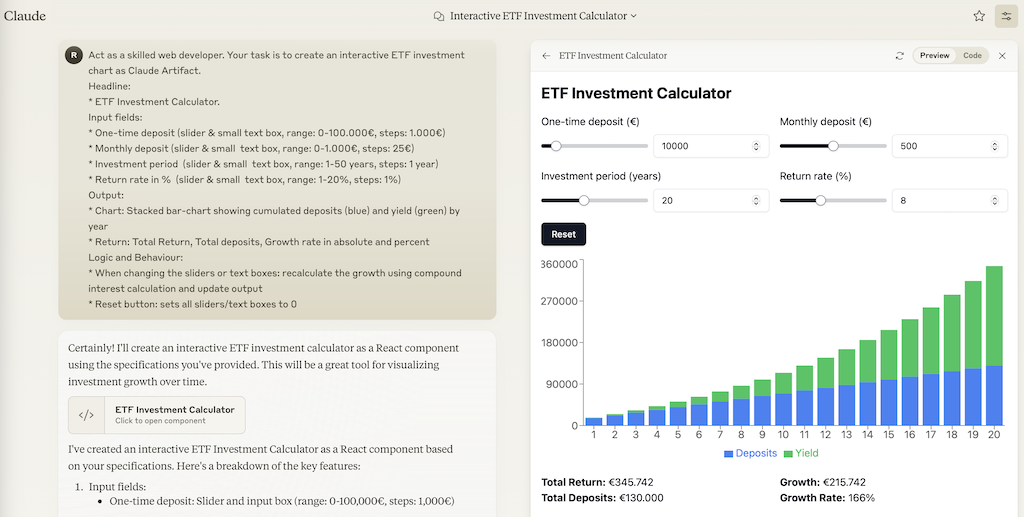
An interactive investment calculator makes it possible to play through an investment, e.g. in ETFs, interactively. Sliders and coloured bar charts can be used to visualize the result quickly and attractively.

Prompt for the investment calculator:
In the prompt, we describe the calculator in a nicely structured way according to input / output / logic & behavior. We specify how the sliders should react and what the value ranges are. For good usability, we choose sliders with text boxes.
Prompt:
Act as a skilled web developer. Your task is to create an interactive ETF investment chart as Claude Artifact.
Headline: ETF Investment Calculator
Input fields:
- One-time deposit (slider & small text box, range: 0-100.000€, steps: 1.000€)
- Monthly deposit (slider & small text box, range: 0-1.000€, steps: 25€)
- Investment period (slider & small text box, range: 1-50 years, steps: 1 year)
- Return rate in % (slider & small text box, range: 1-20%, steps: 1%)
Output:
- Chart: Stacked bar-chart showing cumulated deposits (blue) and yield (green) by year
- Return: Total Return, Total deposits, Growth rate in absolute and percent
Logic and Behavior:
- When changing the sliders or text boxes: recalculate the growth using compound interest calculation and update output
- Reset button: sets all sliders/text boxes to 0
Possible prompt extensions:
- Use decimal points on the axis to make numbers more readable, e.g. €100,000
- Show a reference investment as line, based on 2 % return rate (Product: “Fixed-term deposit”)
Video: Interactive investment calculator in action
Frequently Asked Questions & Tips
How much does Claude.ai cost?
Claude is available for free or as a Pro version (approximately €22 per month) or Team version (for at least 5 users, approximately €34 per user/month). The free version has usage limits, allowing only a few prompts per day. See Claude Pricing for more details.
What can I do if my application is not working?
Claude occasionally makes errors when generating code. The easiest way to proceed is to describe the error and include it in the follow-up prompt, for example, “Error: charts are not updating” or “Fix this: Fonts are too small.”
Do I need to know how to program to use Claude Artifacts?
No, you can often get the desired result without coding skills. It helps to have some technical understanding of what causes errors or how to name certain elements to describe them better in a prompt. However, you don’t need to work in the code to use Claude.


