Data analysis with ChatGPT (Update May 2024)
With ChatGPT you can easily analyze data and visualize it with charts. Since GPT-4o and the OpenAI update in 05/2024, ChatGPT can create interactive charts and more. Here is our…
With ChatGPT you can easily analyze data and visualize it with charts. Since GPT-4o and the OpenAI update in 05/2024, ChatGPT can create interactive charts and more. Here is our step-by-step tutorial, with video and all prompts to follow.
Update:
- 16.5. 2024: ChatGPT update“Improvements to Data Analysis in ChatGPT” (e.g. interactive charts)
📖 This article is part of our comprehensive ChatGPT guide. Read the full guide →
Advantages of AI-based data analysis with ChatGPT
Data analysis is extremely important as it enables better, data-based decisions to be made in day-to-day business. An AI like ChatGPT offers extremely easy access to the data, as you can simply ask your questions via chat instead of using Python or SQL as before. The most important advantages of AI-supported data analysis are
- Data democratization: data analysis is possible for (almost) everyone. There is no need to go through specialists and infrastructure that are difficult to access.
- Automation: Data analysts are supported in their routine tasks and can apply their knowledge to more complex problems.
- Greater accuracy: data analysis via LLM can minimize human error in data analysis
- Real-time analysis: Immediate evaluation and reaction to data changes without having to wait for specialists.
However, care must be taken when using AI in the highly professional field of data analysis. This is because AI hallucinations and interpretation errors must be reliably detected to avoid errors in business analysis. Data analysts normally ensure this by constantly checking, explaining the results and providing support for the further use of the data.
Step-by-step tutorial: Data analysis with ChatGPT
From data selection to visualization, we show you the step-by-step procedure for professional data analysis.
Overview of the steps:
- Select and prepare data
- Understanding data: Data Dictionary
- Data analysis with ChatGPT
Step 1: Select and prepare data
If you want to analyze company data, you can ask your IT department for an export, e.g. of the store system (“transaction data”) or request a customer database (anonymized so that no personal data is disclosed). Such data often has to be laboriously prepared, e.g. in the case of defective, missing or incorrect data. This will lead to a) errors in the analysis or – even worse b) incorrect results. Incorrect results are not easy to recognize, so they should be excluded during data preparation.
Read also: GPT-5.3 Codex: The autonomous coding agent is here

If you want to analyze private data, you can also create a budget book from your online banking data. To do this, simply export the data, remove sensitive data in Excel and save as CSV or Excel.
If you don’t have your own data, the data platform Kaggle.com offers numerous well-documented free, professional data sets from all sectors, e.g. weather data, bookings, financial transactions, store data and much more. This makes it easy to try out what is possible and repeat this later with your own data. The Kaggle documentation explains each field in detail, making it easier to interpret the data. This metadata is particularly helpful for the LLM when analyzing, as you can ask your questions in natural language and ChatGPT can search for the corresponding fields and values independently.
A data set in Excel or CSV format is suitable for analysis in ChatGPT. You can upload the data in zip format to be able to analyze more data and save time.
Our example: Kaggle dataset for hotel bookings
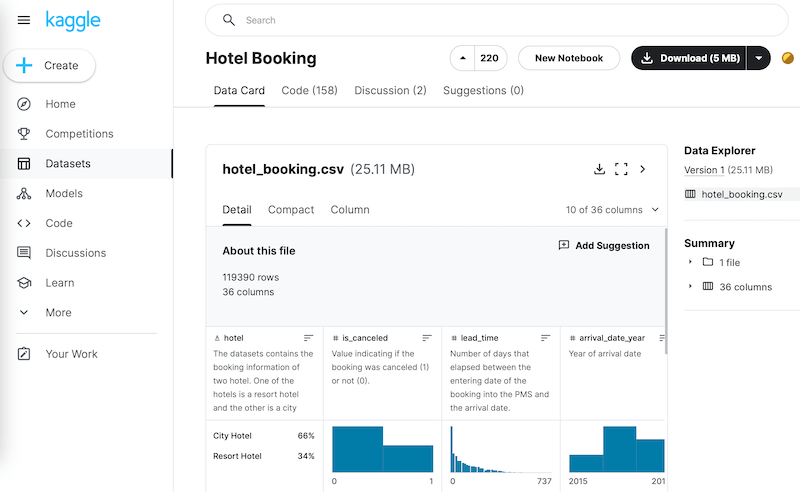
We choose a hotel booking dataset from Kaggle as an example. The data includes hotel bookings and cancelations from 2015-2017 for two hotels: a city hotel and a holiday resort. The data set comprises 120,000 transactions. Each transaction has 36 properties. This means that we already have a fairly large file that can no longer be easily analyzed in Excel. However, this is not a problem for ChatGPT’s data analysis functionality.
Download: Hotel dataset at Kaggle.com
- URL: https://www.kaggle.com/datasets/mojtaba142/hotel-booking
- Register for free, then download possible
Step 2: Understanding data – Create a data dictionary
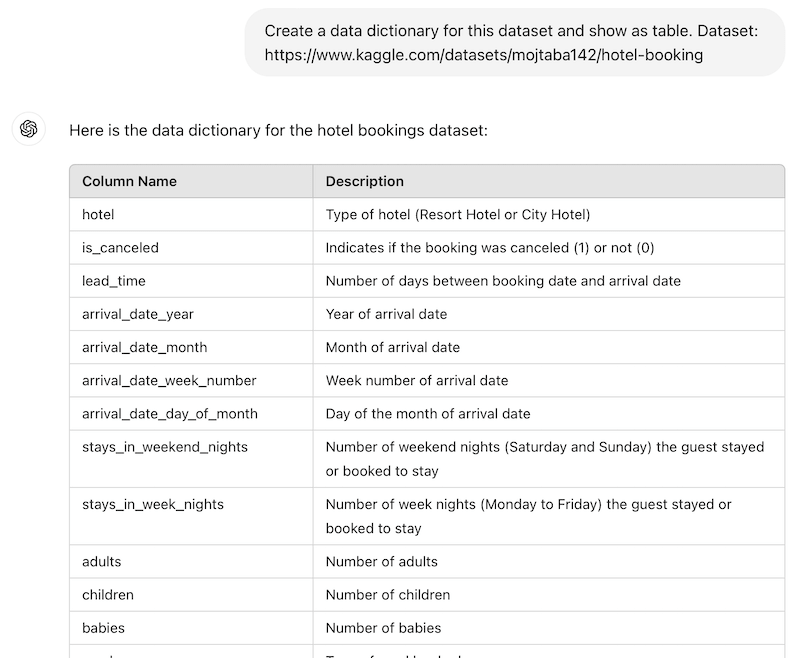
A “data dictionary” often helps to understand the data. A data dictionary is an overview of the data set that contains, for example, all fields and their meaning. The dictionary significantly improves the quality of AI-based data analysis, as the LLM knows the meaning of the data and can easily translate all user questions. The data dictionary is particularly helpful when there are many fields or field values that are not self-explanatory.
Prompt: Create data dictionary
As we use a well-documented Kaggle dataset, we simply extract the field descriptions from the website using this prompt.
Create a data dictionary for this dataset and show as table.
Dataset: https://www.kaggle.com/datasets/mojtaba142/hotel-booking
Tips for the data dictionary
- Structure: The structure should contain the exact field name, the description of the field and the values and, optionally, the data type. Example: is_cancelled; boolean; describes if the booking was canceled (1) or not (0)
- Mark missing values: If data is missing, this should be made clear in the dictionary so that the data is interpreted correctly or can be automatically excluded (e.g. “Data for field “is_cancelled are missing or wrong between January to March 2024”). This can be done in a comment column next to the field or generally noted.
- Create data dictionary via AI: With ChatGPT you can try to create a data dictionary from the data. However, it is essential to check this, as some field values may be unclear (e.g. product category “WK10”, “WK20” etc.)
- Save data dictionary: It is best to save the data dictionary as a structured CSV or Excel file. This way you can view it at any time and, above all, easily include it in the AI analysis by uploading the dictionary file to ChatGPT with the prompt.
Recommended: Xcode 26.3: Agentic Coding with Claude & Codex
Step 3: Data analysis with ChatGPT
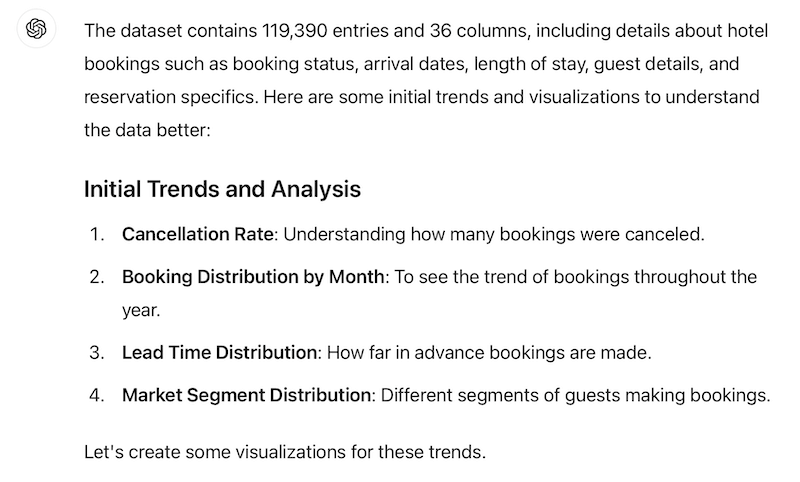
Now we pass the data set and data dictionary to ChatGPT for analysis. If you provide sufficient context for the data in the prompt (e.g. “data set for hotel bookings”), the AI can even suggest and perform the most important analyses independently. Advantage: This saves an enormous amount of time and you don’t have to ask a data specialist what is possible.
Prompt: Data analysis in ChatGPT
Act as a skilled data analyst. Here is a Kaggle dataset on hotel bookings.
Your task is to analyze the data and show some first trends in charts.
Result: ChatGPT shows the data structure and suggested analyses
Tips for prompting:
- Context improves the result: The more context you give the AI, the more helpful the result can be. Here you have to find a good balance between the directness of the task and the context so that the task is solved by the LLM in a targeted manner.
- Use Chain of Thought technology: If you are planning more complex, comprehensive analyses, you should carry them out one after the other or have an analysis plan drawn up first, otherwise the AI will often arrive at premature, unclean results. Use the “Chain of Thought” technique. Example: “Analyze the users, behavior, trends and more. Think on this step by step.” This simple sentence leads to ChatGPT first creating a plan and then (usually) working through it step by step.
Step 4: Interactive ecommerce data analysis with ChatGPT
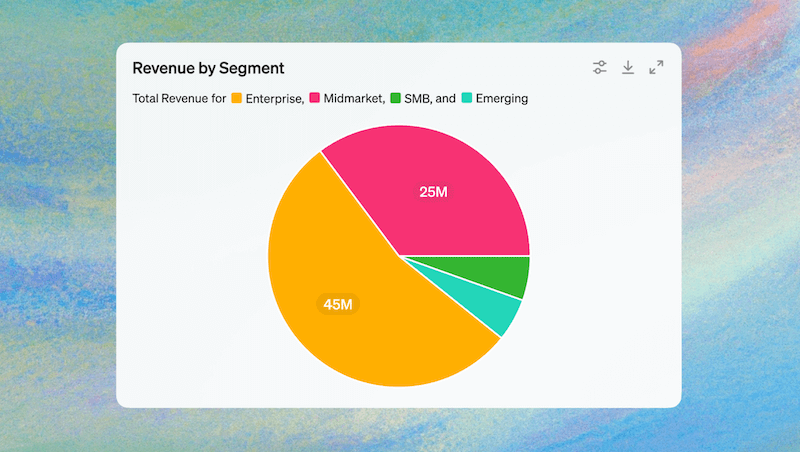
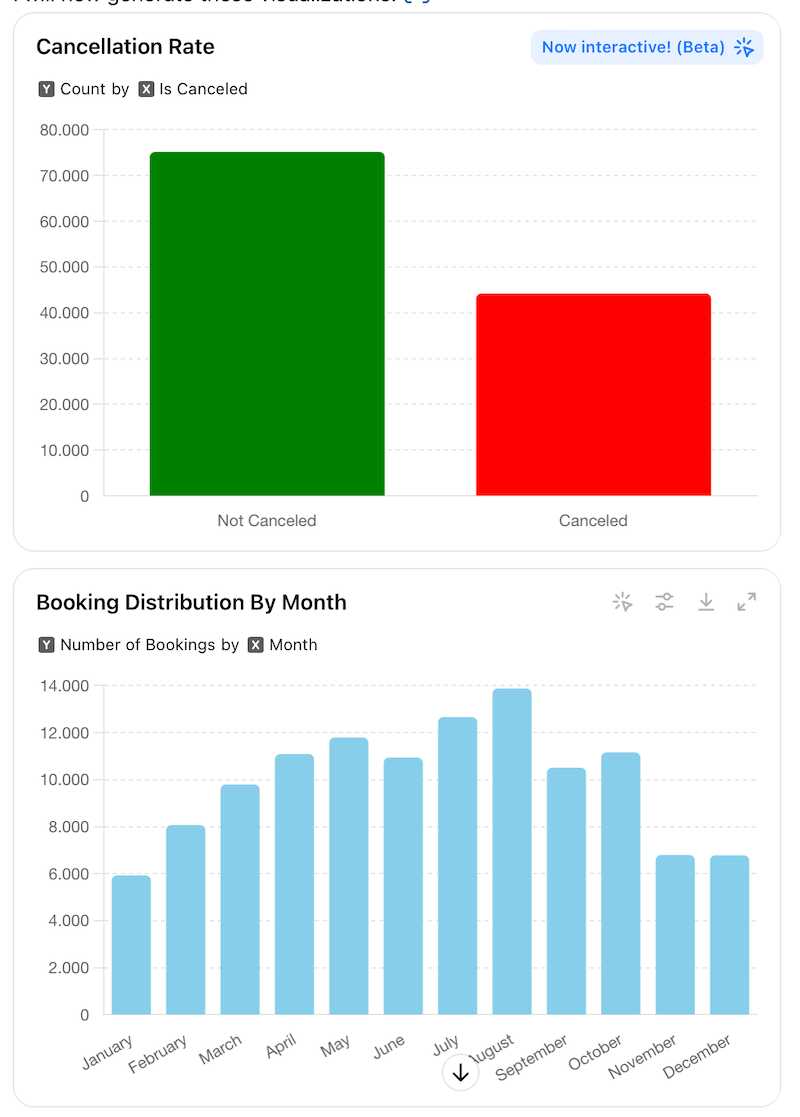
The most important analyses in the hotel example and ecommerce include the cancellation rate and bookings by month. ChatGPT displays these interactively. You can hover over it to see the exact value of the data (e.g. 42,123 cancelations). You can also zoom in on the data, click through the charts and ask follow-up questions.
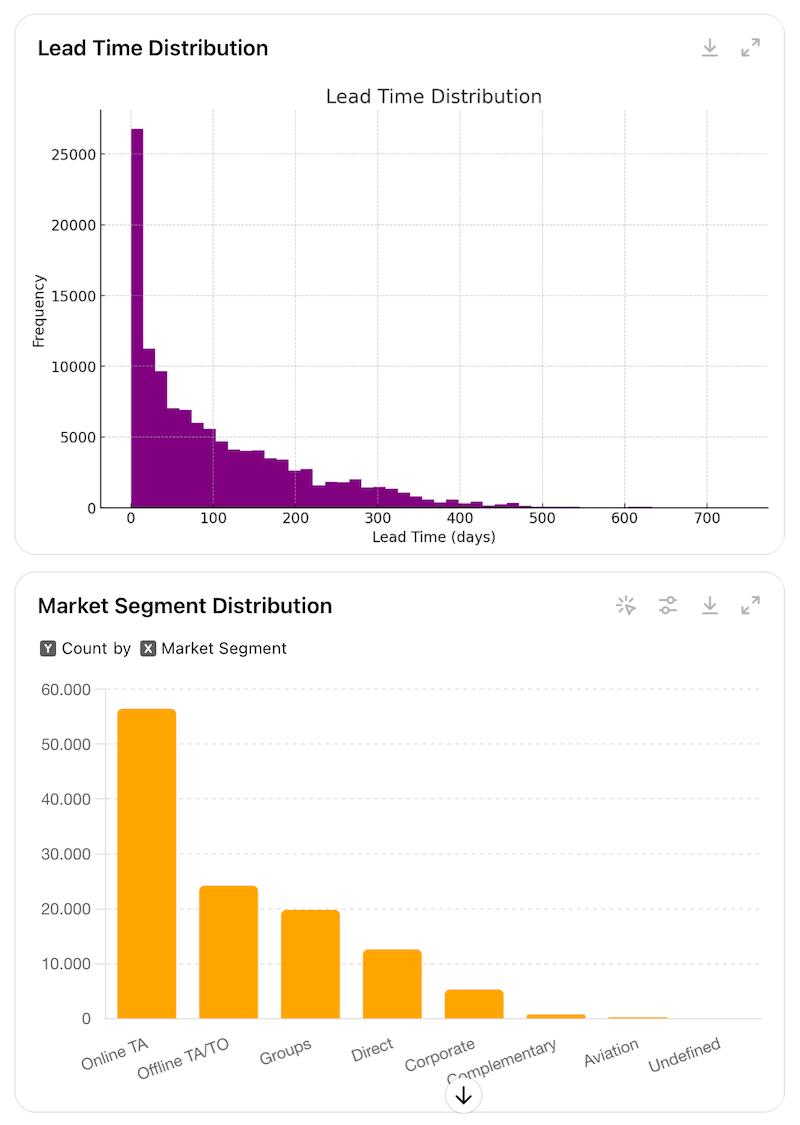
It is often interesting to see how far in advance users book a hotel(lead time distribution) so that you can adjust your marketing and availability planning accordingly and also identify differences in booking behavior. This can provide information about correlations, e.g. how trade fair events influence hotel bookings and more. Analyzing specific market segments of users or, for example, hotel room types (business suite, 2-bed or family room) also helps to better understand user demand.
Video: Interactive data analysis with ChatGPT
The following video shows how ChatGPT’s new features in the GPT-4o model make it easy to click through all analyses. This makes data analysis much easier. This makes it quicker to gain exciting insights.
Tips for data analysis
- Start simply with charts: Data analysis does not have to be complex. Simple charts of the right 2-3 dimensions and metrics already provide valuable insights. Example: Bookings per month, comparing 2022 to 2023 and 2024
- Correlate: By superimposing the progression of two metrics, you can determine correlations. Example: Hotel bookings vs. rainy days per month.
- Segment, segment, segment: Important insights are often hidden. You can find these by examining (“segmenting”) parts of the data. Example: Cancellations business class vs. economy class.
- Data storytelling: Data does not speak for itself. Explain the insights step by step in a PowerPoint presentation. Tip: The headline should clearly state the insight, e.g. “Cancellations have been increasing since 2023”, instead of using general headlines such as “Analysis trends” etc. Use green and red speech bubbles to point out potentials or problems.
Further sources for AI-based data analysis
- Data Analysis with ChatGPT – Data analysis overview from OpenAI (e.g. formats, capabilities)
- Youtube: New ChatGPT Data Analysis is Mind Blowing – The most important features shown by Data Leap AI
AI Rockstars verdict
TL;DR: ChatGPT can support data analytics by explaining datasets, writing formulas, drafting SQL or Python, generating charts, and summarizing findings. The quality depends on clean data, explicit questions, and validation of every conclusion.
Editorial recommendation: Use ChatGPT for analytics acceleration, not unsupervised reporting. Give it clear metric definitions, ask for reproducible steps, and verify outputs with source data before sharing insights.
How to use ChatGPT for data analytics safely
| Factor | Priority | Why it matters |
|---|---|---|
| Question definition | Critical | The model needs a precise analytical goal. |
| Metric definitions | Critical | Ambiguous metrics produce misleading answers. |
| Reproducible steps | High | SQL, formulas, or code make results easier to verify. |
| Conclusion review | Critical | Business decisions require human validation. |
FAQ
Can ChatGPT analyze data?
Yes. ChatGPT can help summarize datasets, write analysis code, explain patterns, and draft reports.
What data tasks are best for ChatGPT?
It is useful for exploratory analysis, formula help, SQL or Python drafting, chart explanations, and report summaries.
What is the main risk?
The main risk is accepting plausible but incorrect conclusions without checking the data and methodology.
Related AI Rockstars Guide
Turn one repetitive task into a working AI workflow.
Use the AI Automation Playbook for practical, step-by-step workflows built for small businesses and lean teams.


