✓ ReviewedLast updated June 10, 2026 by Ralf Schukay
Generative AI makes it possible to analyze data directly on demand and gain insights. Current solutions from Google and Microsoft impressively demonstrate how this makes data analysis easier for everyone.
If you want to complete your job tasks based on data such as statistics, sales figures or web analytics data, you often have to wade through tables and sometimes complicated and overcrowded dashboards. Generative AI now makes it possible to ask analytics questions directly and simply by prompt or voice input. Example: “Show the sales of the top 10 products by month”. This makes spontaneous data analysis much easier. You simply ask your data, so to speak.
Many BI analytics providers are increasingly integrating more generative AI features into their products in order to simplify data analysis for users. The industry giants Google and Microsoft offer good solutions here, which we present below.
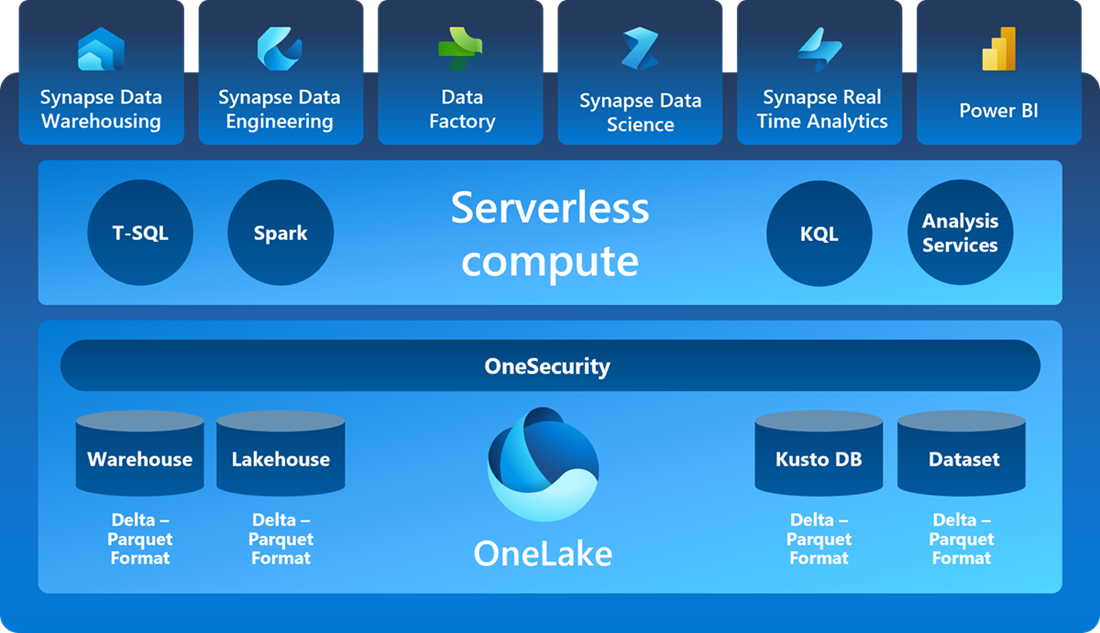
Microsoft’s new analytics flagship product is called Microsoft Fabric. The enterprise data solution makes it possible to store data in a data lake (OneLake) in the Microsoft cloud and process it with numerous Microsoft tools. The data is visualized in the reporting solution Power BI, which is particularly popular among companies.
Key facts: Microsoft Fabric & Power BI
Provider: Microsoft
Type: BI platform
Special features: Fabric combines data engineering, data science, data analytics and reporting under one roof. It comprises around 10 Microsoft products such as Synapse Analytics and Power BI that work together optimally.
Hosting: Azure Cloud
Required licenses: The following version is required for the AI Analytics features:
Fabric F64 capacity: from 5,000$/month with 12-month reservation (price overview)
Power BI: from 20€/month per user for Power BI Premium per user
Microsoft Fabric ist based on the OneLake data lake, enhanced with features from data warehousing, data science, ETL and the Power BI reporting solution. (Image source: Microsoft Learn)
GenAI-supported analyses with Power BI & Microsoft Fabric
Microsoft offers generative AI features that simplify data analysis and reporting for enterprise customers who have a correspondingly high license of Fabric or Power BI. The standard Power BI license is therefore not sufficient, as this is a premium feature. Power BI & Fabric offers the following AI features:
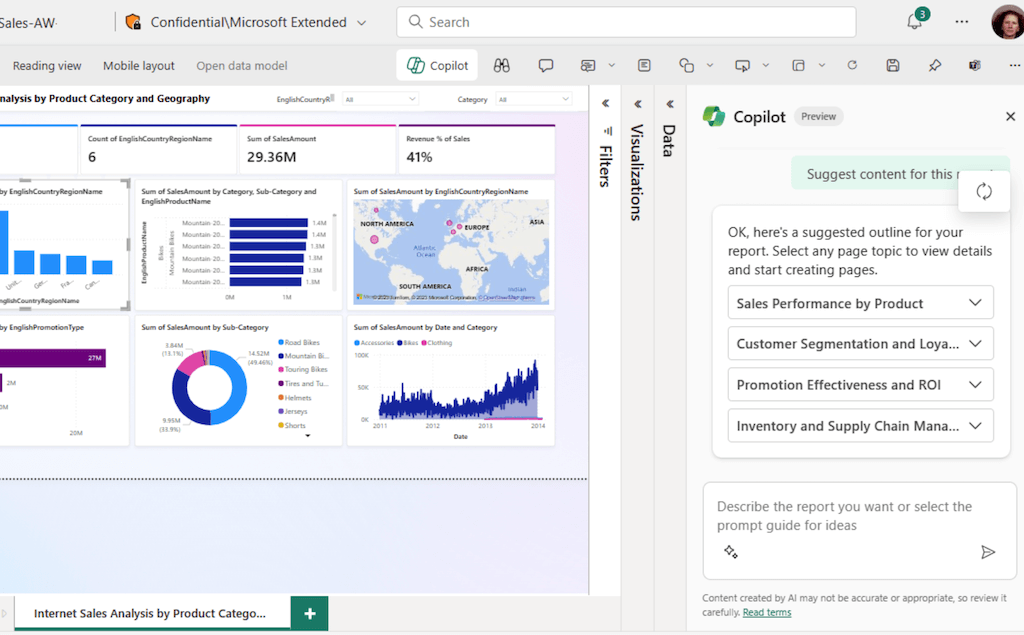
Report creation: Automatic report outlines and report page creation
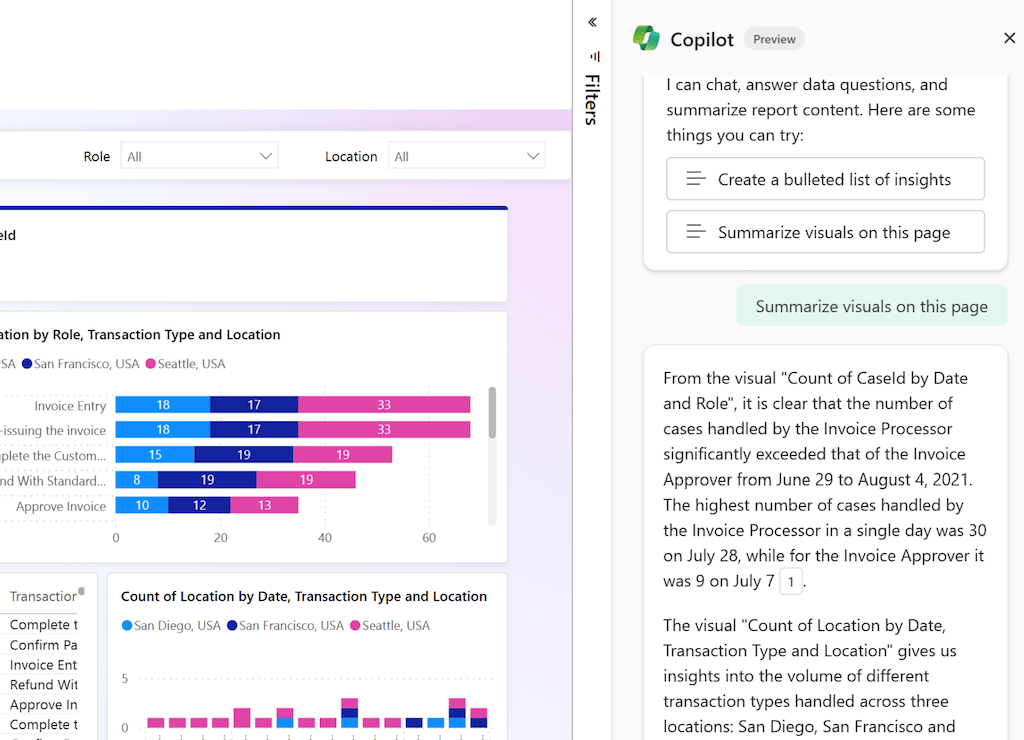
Report summary: AI-generated written summaries of the reports (as a report widget or in the Copilot chat)
Create DAX formulas: DAX formulas are created via text prompt. This solves one of the biggest difficulties in Power BI for beginners.
Q&A: The Q&A module, available to all Power BI users, allows data to be queried via chat. Thanks to the generative AI features, the module can be automatically trained even better so that questions are answered more reliably
The generative AI features require prerequisites and have limitations, but are constantly being expanded. For example, although it is currently possible to create report pages, these cannot be modified by prompt, but must be done manually in the usual way. Power BI skills are therefore still important.
Creating reports with Copilot: Copilot automatically makes suggestions for helpful report pages based on the data sources provided and creates suitable charts.
Microsoft Copilot in Power BI helps to create reports and analyze data
Automatic data analysis with Copilot: Copilot summarizes the development in the charts as texts, making interpretation easier.
Automatic report interpretation in Power BI with Fabric (Image source: Microsoft)
The BI solution Google Look er (see Google product page, not to be confused with Google Looker Studio) makes it possible to semantically process your company data using your own data models. To do this, data is read in from various sources and the metrics are defined using the LookML language in JSON format and SQL. Video tutorial: Getting started with Looker (2023). Looker offers additional enterprise features for its high price, such as automatic generation of presentations from the data and more. To visualize the data as dashboards and analyze data, you can use the popular free Google Looker Studio (or the enterprise version Looker Studio Pro).
Key facts: Google Looker
Provider: Google
Type: BI platform
Hosting: Google Cloud or On-Premises
Required licenses: Looker Studio Looker Studio licenses per reporting user and report developer
Costs: individual (unofficial price information: from approx. 2,900 $ / month, see article on pricing)
GenAI-supported analyses with Google Looker
Generative AI features have been available in Google Looker since 2024. This greatly simplifies the work of everyone who needs this data and increasingly automates the job profile of reporting specialists. Looker offers the following AI features:
Conversational Analytics: data analysis via text prompt (chat), makes analysis intuitive
Dashboard creation via text prompt, helps report developers to create reports faster
Slide creation via text prompt, for data presentations in meetings
Formula creation of LookML formulas via text prompt, saves work with
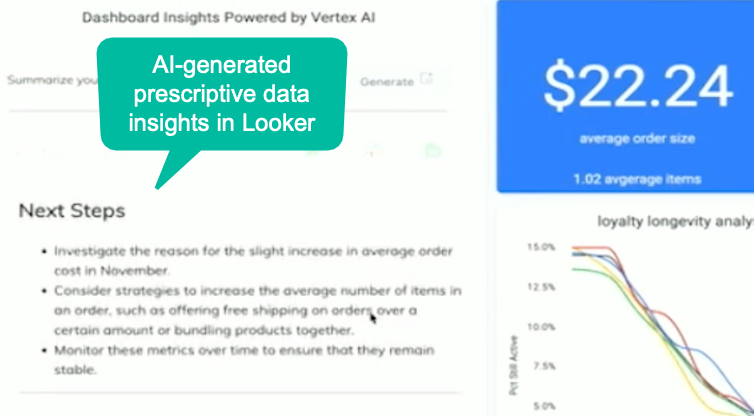
AI-generated insights: AI-generated textual summaries automatically identify trends and suggest next steps
Conversational Analytics in Looker using Gemini (Image source: Google)
The advantages are that data is easier to understand thanks to the natural language query via chat prompt and decision-makers are no longer dependent on specialists. This means that data is available immediately and saves time and effort for complex reporting projects. In future, this will enable an optimal mix in collaboration: reporting creators provide helpful basic reports that can be analyzed by users much more easily and in greater depth than before. The generative AI features also make it much easier for business users to create their own dashboards instead of having to deal with complex formulas.
AI generated Insights in Google Looker using Vertex AI and Google Gemini (Image source: Google)
Conclusion: Advantages of generative AI in data analysis
No company can do without data. Until now, creating and analyzing reports has been a task that required reporting specialists. The introduction of generative AI features in the Looker and Fabric business BI solutions saves time and effort and simplifies reporting and data analysis. This enables corporate customers to use their data even better and, above all, more easily within the company. Insights from data become easier to use.
Summary: What are the benefits of generative AI in reporting and data analysis?
Enabling analyses for all users (including non-specialists)
Potential for KPI improvements through more intensive use of data in decisions
Better, faster reporting
Save effort in reporting and analyses
Compensate for the lack of specialists in the data area
TL;DR: Generative AI in analytics is most useful when it sits on governed semantic models, clean metrics, and trusted data warehouses. It is not a replacement for data modeling; it makes good analytics systems easier to query and weak ones noisier.
Editorial recommendation: Start with high-value business questions, metric definitions, and access rules before rolling out AI analytics broadly. Looker, Power BI, and Fabric can all help, but governance determines whether the answers are trustworthy.
AI analytics readiness checklist
Factor
Priority
Why it matters
Defined business metrics
Critical
AI answers are only useful when revenue, users, margin, churn, or campaign metrics are unambiguous.
Trusted data model
Critical
Semantic layers and modeled datasets reduce hallucinated or inconsistent answers.
Access control
Critical
AI assistants must respect permissions and sensitive data boundaries.
Analyst review workflow
Important
Teams should validate generated insights before operational decisions.
FAQ
What is generative AI analytics?
Generative AI analytics uses natural language prompts to query, summarize, and explain business data from tools such as Looker, Power BI, Fabric, or data warehouses.
Does AI replace BI dashboards?
No. AI can make analysis faster, but dashboards, semantic models, and governed metrics remain important.
What is the biggest risk in AI analytics?
The biggest risk is trusting answers from poorly modeled, incomplete, or incorrectly permissioned data.
To provide the best experiences, we use technologies like cookies to store and/or access device information. Consenting to these technologies will allow us to process data such as browsing behavior or unique IDs on this site. Not consenting or withdrawing consent, may adversely affect certain features and functions.
Functional
Always active
The technical storage or access is strictly necessary for the legitimate purpose of enabling the use of a specific service explicitly requested by the subscriber or user, or for the sole purpose of carrying out the transmission of a communication over an electronic communications network.
Preferences
The technical storage or access is necessary for the legitimate purpose of storing preferences that are not requested by the subscriber or user.
Statistics
The technical storage or access that is used exclusively for statistical purposes.The technical storage or access that is used exclusively for anonymous statistical purposes. Without a subpoena, voluntary compliance on the part of your Internet Service Provider, or additional records from a third party, information stored or retrieved for this purpose alone cannot usually be used to identify you.
Marketing
The technical storage or access is required to create user profiles to send advertising, or to track the user on a website or across several websites for similar marketing purposes.