With Translytical Task Flows, you can change data directly from a Power BI dashboard, saving tedious detours via other tools. This ensures better processes, faster customer service and better maintained data.
What are Translytical Task Flows?
Translytical Task Flows, introduced in Power BI and Microsoft Fabric in May 2025, combine analytical and transactional tasks in the company. For example, users can perform tasks such as changing a discount value or adding information to customer/lead records directly in Power BI reports. This is practical, as many data changes are often noticed when analyzing the data in the dashboard. In the tight daily schedule, it is not yet practical to write an email to the customer service team, for example, to change incorrect data while analyzing.
It is true that not all data in the company can be changed directly in this way, e.g. to protect important master data from errors. But for some use cases, this is certainly conceivable and helpful. You can also trigger approval processes, i.e. data changes are viewed in advance by the right department or messages are sent to colleagues who then take care of the changes. The new flows therefore speed up communication and processes within the company.
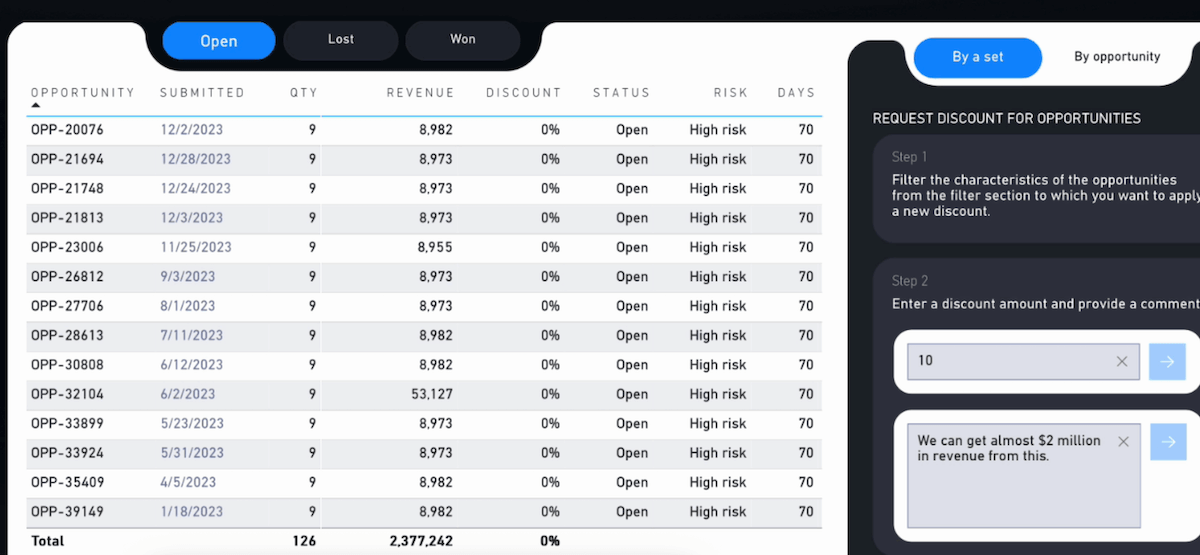
Example: Requesting a discount change directly in the Power BI dashboard via a Teams message

What are the advantages of Translytical Task Flows?
Translytical task flows combine analysis and data changes. This may sound somewhat abstract and unnecessary, but the separation of analysis and adaptation is a normal part of everyday life in many companies and causes delays and additional costs. This is where new processes with a more agile approach can help.
These are the advantages of Translytical Task Flows:
- Enable new, efficient workflows: Data can be changed directly during evaluation, which saves time
- Create new tools: With Power BI as a foundation, innovative data-focused tools can be created quickly.
- Better usability when making changes: Dashboards are often slightly clearer than old core applications
- Better data quality: errors and gaps can be corrected immediately without waiting for other teams
Practical examples of translytic processes
Typical conceivable fields of application for the combined analysis/operations processes are all types of data changes or actions that become apparent during the analysis. Examples of this are
- Qualification of sales leads directly from Power BI, e.g. increase new customer discount, add new information, change errors
- Updating campaigns and price information, e.g. for discount promotions
- Update product catalog: AI-supported adjustments to incomplete product data, e.g. via Azure OpenAI
- Address external APIs to connect third-party providers, e.g. weather APIs, logistics service provider APIs for shipment tracking, etc.
- Direct correction of data errors: Analytics teams can immediately correct errors detected in the Power BI dashboard (e.g. inconsistent or missing data) without having to wait for long feedback cycles with operational teams. This significantly reduces rework and delays.
- Note analysis questions in the dashboard: A comment log with analysis questions from stakeholders can be integrated directly into the dashboard. This helps to make better use of the dashboards and solve data quality problems more quickly.
Example: Power BI dashboard with discount change request for potential new customers (opportunities)
Which systems can be controlled with Translytical Task Flows?
Translytical Task Flows allow users in Power BI to change individual or multiple data records from the systems connected to the dashboard in real time. Workflows can also be started or notifications triggered. Examples of possible systems are
- SQL databases
- Data warehouses and data lakes
- Addressing AI services, e.g. Azure OpenAI
- Addressing external APIs, e.g. CRM or ERP systems for direct customer and order management
- Start workflows, e.g. Power Automate Flows or Dynamics processes
- Post messages, e.g. via Slack, Teams or email
Setup: How to create Translytical Task Flows in Power BI and Fabric
Microsoft Fabric is required for the new Translytical Task Flows. Here there are the User Data Functions, which make it possible to perform actions such as updating, adding or deleting data records in databases directly from Power BI. Power BI can then be connected to SQL databases, warehouses and lakehouses and other systems via Microsoft Fabric. The changes are always context-related, e.g. in line with the Power BI report filters set (e.g. by country, branch, business unit, etc.).
Tutorial: How to Create a Translytical Task Flow
First, we enable the preview features in Power BI and Fabric so that we can use the new Task Flows. As an example, we select a flow from the Microsoft Fabric demos that lets you create annotations in a dashboard in your own SQL database. Here’s how:
Step 1: Enable Preview Features in Power BI
- File > Options > Preview Features > “Translytical Task Flows, Text, List, and Button slicers”
Step 2: Enable Preview Features in Fabric
- Settings > Admin portal > Tenant settings > “User data functions”) – Note: There is a waiting time before the feature becomes active
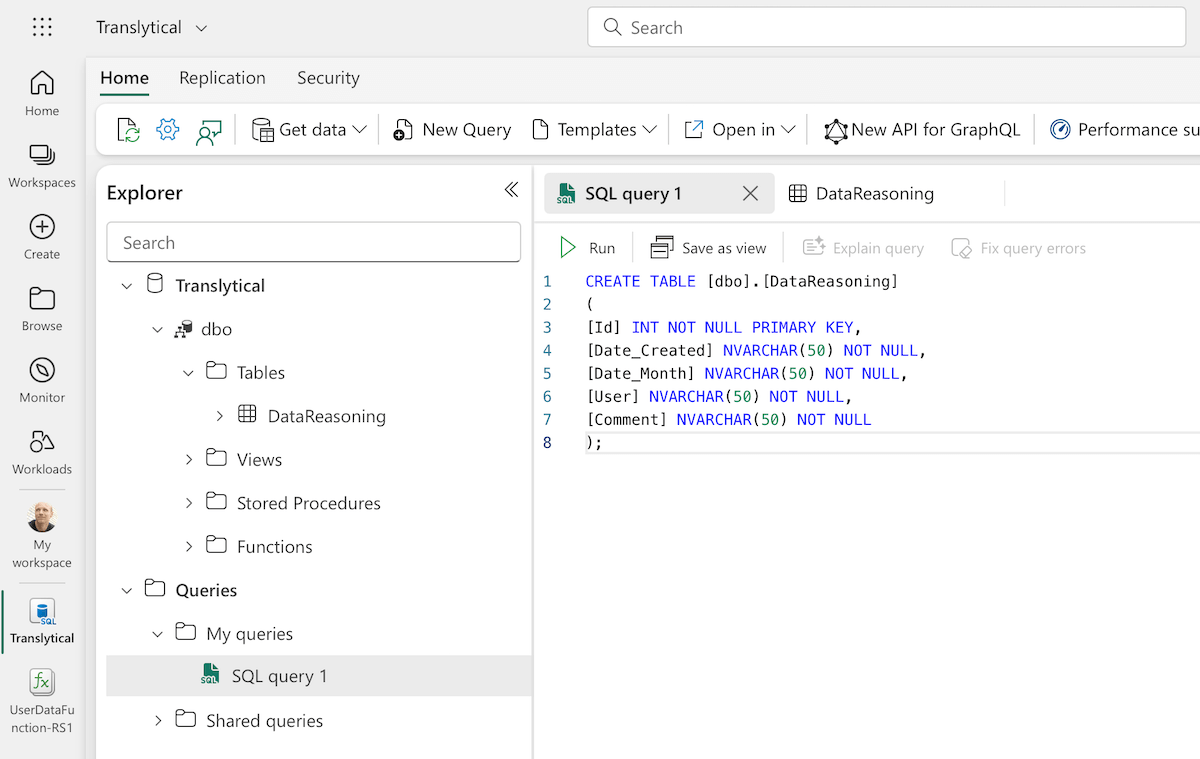
Step 3: Create a SQL Database and Table in Microsoft Fabric
- Name: Translytical
Step 4: Create a Table in the Database in Microsoft Fabric
Insert and execute the following SQL code
CREATE TABLE [dbo].[DataReasoning]
(
  [Id] INT NOT NULL PRIMARY KEY,
  [Date_Created] NVARCHAR(50) NOT NULL,
  [Date_Month] NVARCHAR(50) NOT NULL,
  [User] NVARCHAR(50) NOT NULL,
  [Comment] NVARCHAR(50) NOT NULL
)
Step 5: Create a User Data Function (UDF) in Microsoft Fabric
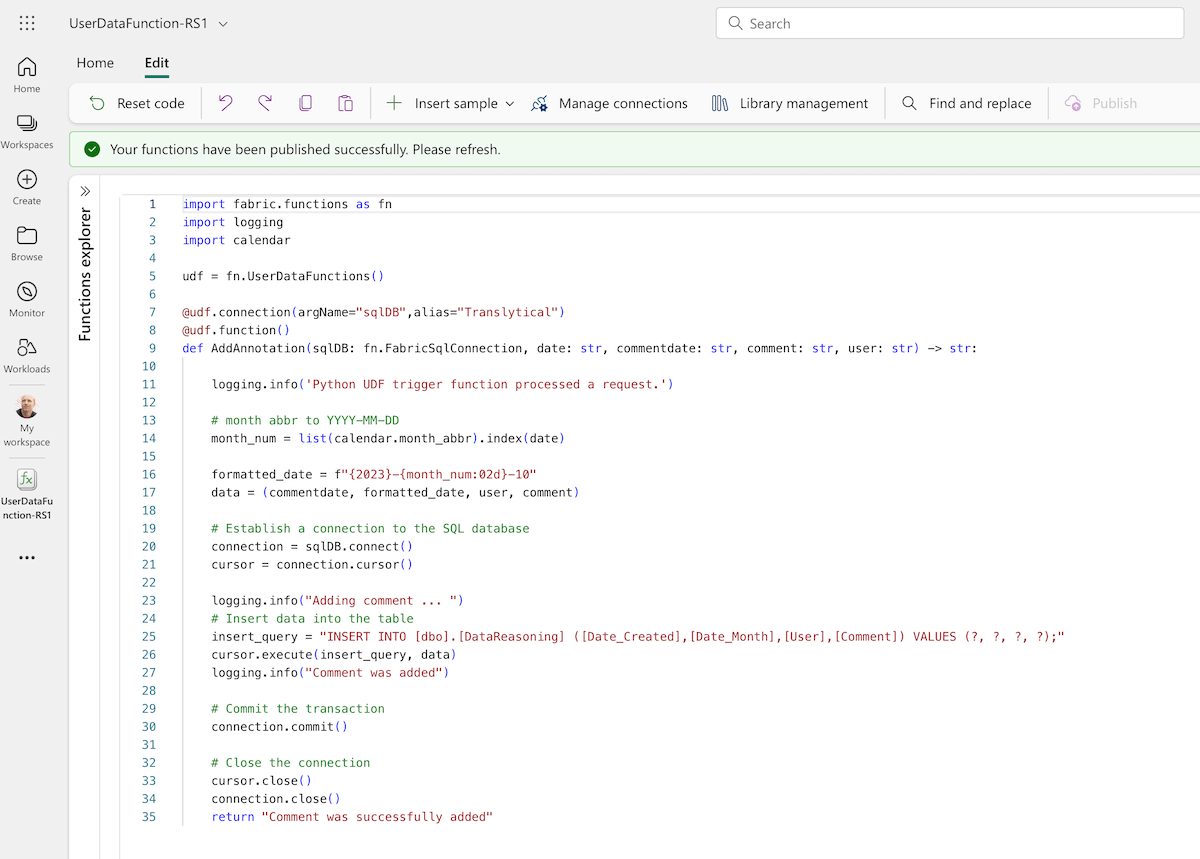
- Create a new User Data Function (plus-icon in left sidebar)
- Manage Connections > Add our SQL Database “Translytical”
- Code: From the code examples in the Microsoft GitHub repo, copy the example “AddAnnotation”
- Publish
Step 6: Create a Dashboard in Power BI
The next steps are to create the report, insert the new preview visuals (text slicer), and connect to the SQL database. The steps are shown in the tutorial linked below.
Learn more:
- Microsoft Learn: Translytical Task Flows – Benefits and setup
- Tutorial: Create a translytical task flow – Step-by-step tutorial from SQL database creation to dashboard
- Edit data in Power BI: Translytical task flows – YouTube tutorial (PorcuBI)
Conclusion: Seize opportunities, keep an eye on risks
Translytical task flows are an important step towards more agility in data work. They create new opportunities to make operational changes directly from the analysis and thus save time, costs and communication loops. However, their use requires clear governance rules, graduated authorizations and an awareness of risks so that the benefits – faster data maintenance, better customer orientation and seamless workflows – can be used safely.
Translytical technology is both unfamiliar and risky, but also full of opportunities. Until now, there has often been a strict separation between data analysis (reading) and data modification (writing) in IT systems. The reasons for this are often the existing rules and processes in the company, as not everyone should be able to change everything, which avoids potentially serious subsequent errors and ensures compliance and data protection. However, it is known that existing processes in companies are often too rigid, causing a lot of time and unnecessary loops at the expense of service quality and end customers. Translytical workflows can therefore be an improvement for selected use cases and processes.
Summary
- Translytical Task Flows merge analysis and operational processes in Power BI. This requires Microsoft Fabric as a data platform.
- Data changes are made in real time and context-related to report data and filters.
- Public Preview – currently in public preview
Source: Microsoft Learn, 20.5.2025


